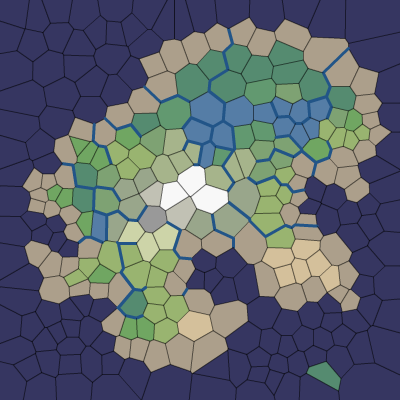
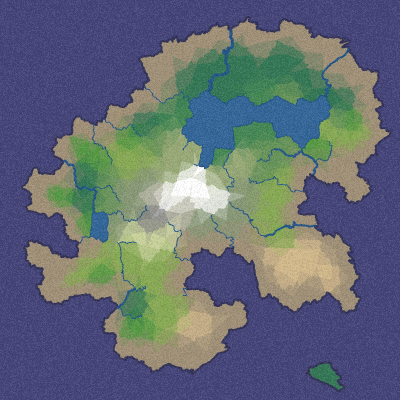
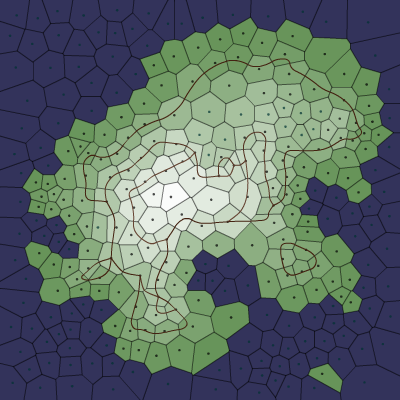
I wanted to generate interesting game maps that weren’t constrained to be realistic, and I wanted to try some techniques I hadn’t tried before. I usually make tile maps but instead used a different structure. What could I do with 1,000 polygons instead of 1,000,000 tiles? The distinct player-recognizable areas might be useful for gameplay: locations of towns, places to quest, territory to conquer or settle, landmarks, pathfinding waypoints, difficulty zones, etc. I generated maps with polygons, then rasterized them into tile maps that looked like this:

Most procedural map generators, including some of my own previous projects, use noise functions (simplex noise, midpoint displacement, fractal, diamond-square, perlin noise, etc.) to generate a height map. I did not do that here. Instead, I used a graph structure to model the things directed by gameplay constraints (elevation, roads, river flow, quest locations, monster types) and noise functions to model the variety not constrained by gameplay (coastline shape, river placement, tree placement).
There were three main things I wanted for this project: good coastlines, mountains, and rivers. For the coastline, I wanted to make island maps that are surrounded by ocean, so that I don’t have to deal with people walking to the edge of the map. For the mountains, I started with something simple: mountains are whatever’s farthest from the coastline, so that you can always walk uphill to reach the top. For the rivers, I started with something simple: draw rivers from the coast to the mountains, so that you can always follow rivers down to the beach.
First, try the Flash demo (2010) or an HTML5 demo[1] (2017). Read on to learn how it works, or get the source code. Here’s the overview of the process:

Every project will have its own gameplay constraints. For this project, the gameplay constraints were partially taken from Realm of the Mad God[2], a multiplayer RPG in which players start on the beach playing alone and then later join together on the mountaintop to fight bosses. Elevation directly corresponds to difficulty, and must monotonically increase, so that was a key constraint in the design. Elevation in Minecraft on the other hand isn’t constrained the same way, so the noise function they use works for that game. In multiplayer Age of Empires, the location of resources is constrained by the need to be somewhat balanced among the players; in Minecraft the distribution of resources is not constrained. When writing your own map generator, think about what which aspects of your map are set by the design and which can vary from map to map. Each of the ideas on this page can be used separately or together in your own map generator project.
1 Polygons#
The first step is to generate some polygons. The simplest approach would be to use a hexagonal grid and perturb it a bit to make it look irregular. This works (and the techniques on this page will work if you use a perturbed grid), but I wanted something even less regular than that, so I picked random points and generated Voronoi polygons[3], which are used for lots of things[4], including maps.
Here’s an example of random dots (red) and the polygons that result:
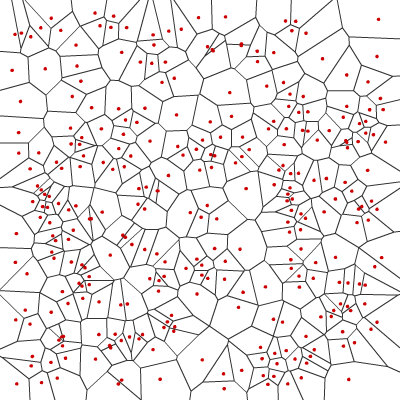
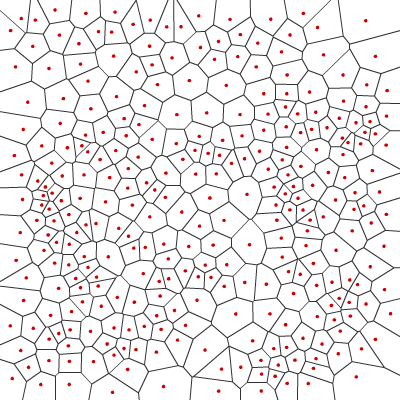
The polygon shapes and sizes are a bit irregular. Random numbers are more “clumpy” than what people expect. I want something closer to semi-random “blue noise”, or quasirandomness[5], not random points. I approximate that by using a variant of Lloyd relaxation[6], which is a fairly simple tweak to the random point locations to make them more evenly distributed. Lloyd relaxation replaces each point by the centroid[7] of the polygon. In my code I merely average the corners. Here’s the result after running approximate Lloyd relaxation twice:
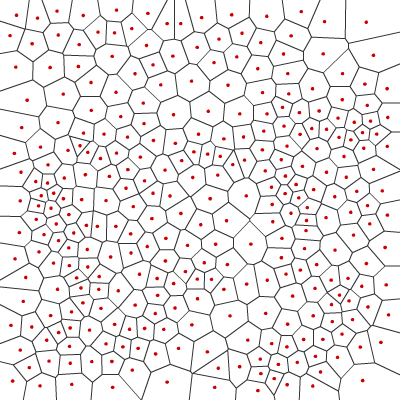
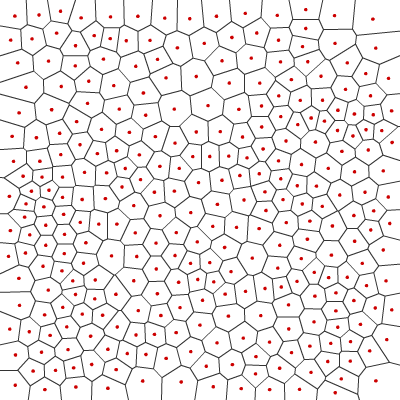
Compare it to running once or fifty times. The more iterations, the more regular the polygons get. Running it twice gives me good results but every game will vary in its needs. In newer projects I use a Poisson Disc algorithm, which generates a nice distribution of points from the start, without iterating through multiple steps of Lloyd relaxation.
Polygon sizes are improved by moving polygon centers. The same approach works to improve edge lengths. Moving corners by averaging the nearby centers produces more uniform edge lengths, although it occasionally worsens the polygon sizes. However, moving corners changes it from a Voronoi diagram to a barycentric dual mesh[8]. The algorithms for this map generator work with either style. Voronoi polygons are more uniformly sized, with varying shapes; barycentric dual polygons are more uniformly shaped, and the corners are more uniformly spaced. In the rest of the article I still call them Voronoi polygons and use screenshots of Voronoi, but the final demo uses the barycentric dual instead.
Alternatives to consider:
- A square or hexagon grid. I use these for most projects because using Voronoi adds quite a lot of implementation complexity. I chose Voronoi for this project because of the needs of the game (rivers and quests).
- A jittered grid[9] is a different way to get scattered points without running Voronoi repeatedly. The quality is lower though.
- Poisson Disc generation is a different way to get scattered points without running Voronoi repeatedly. The quality is good.
- Lloyd Relaxation normally moves the red seed point to the centroid of all the points of a polygon. The alternative I used was to move the red point to the average of the polygon corners. Another alternative is to move the red point to the average of the neighbors (red points of adjacent polygons).
2 Map Representation#
The map contains two related graphs[10] (nodes and edges). The first graph has nodes for each polygon and edges between adjacent polygons. It represents the Delaunay triangulation[11], which is useful for anything involving adjacency (such as pathfinding). The second graph has nodes for each polygon corner and edges between corners. It contains the shapes of the polygons. It’s useful for anything involving the shapes (such as rendering borders).
The two graphs are related. Every triangle in the Delaunay triangulation corresponds to a polygon corner in the Voronoi diagram. Every polygon in the Voronoi diagram corresponds to a corner of a Delaunay triangle. Every edge in the Delaunay graph corresponds to an edge in the Voronoi graph.
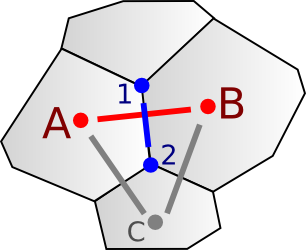
Polygon A and B are adjacent to each other, so there is a (red) edge
between A and B in the adjacency graph. For them to be adjacent
there must be a polygon edge between them. The (blue) polygon edge
connects corners 1 and 2 in the Voronoi shape graph. Every edge in
the adjacency graph corresponds to exactly one edge in the shape graph.
In the Delaunay triangulation, triangle A-B-C connects the three
polygons, and can be represented by corner 2. Thus, corners in the
Delaunay triangulation are polygons in the Voronoi diagram, and vice
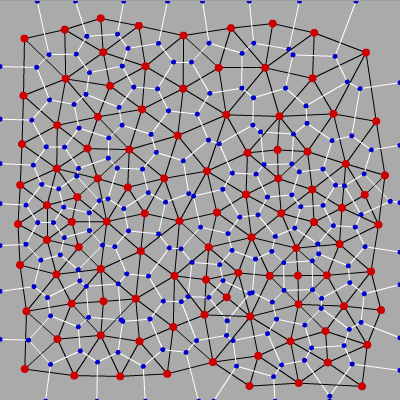
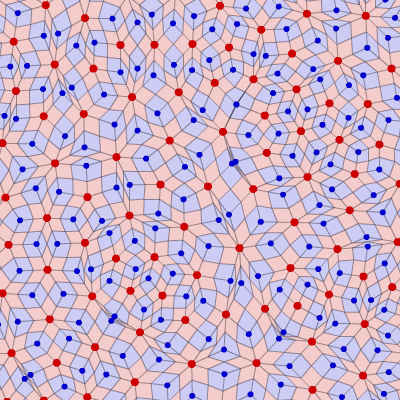
versa. Here’s a larger example showing the relationship, with Voronoi
polygon centers in red and corners in blue, and the Voronoi edges in
white and the Delaunay triangulation in black:
We could store these graphs independently, but storing them in a combined format allows moving back and forth between the two. For this project, instead of representing two edges in the two graph separately, I made edges point to four nodes: two polygon centers and two corners. For later projects I used Delaunator[12]’s compact integer represenation to store the two graphs together.
3 Islands#
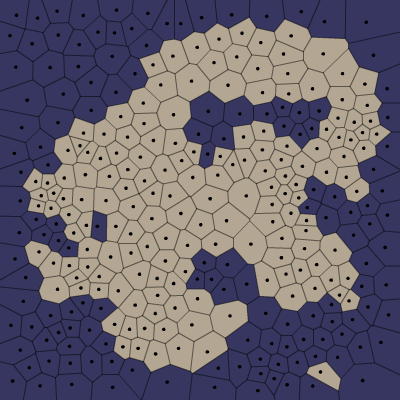
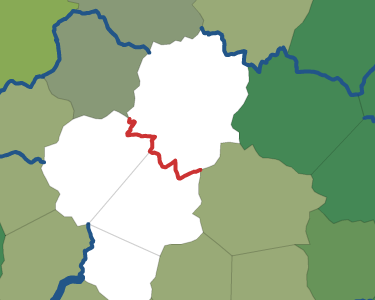
The second step is to draw the coastline. The borders of the map need to be water, but you can mark the other polygons as either water or land, using any approach you want. The coastline is then all the edges where land and water meet.
Here’s an example that divides the world into land and water:
In this project, I used a radial method (combination of sine waves on a polar plot), a noise function[13], a square, and my blob logo. In mapgen4[14] I let the user draw their own shape. You can use any shape, including pizza box stains[15] or clouds[16] or a torn up sheet of paper[17].
Since there are two graphs (visualized with red points and blue points), there’s a question of which graph to use here. For this project I first assigned land/water to the corners (blue points) using noise or some other algorithm, and then assigned land to the polygons (red points) by looking at what fraction of corners were under water. I don’t know if this is the best way.
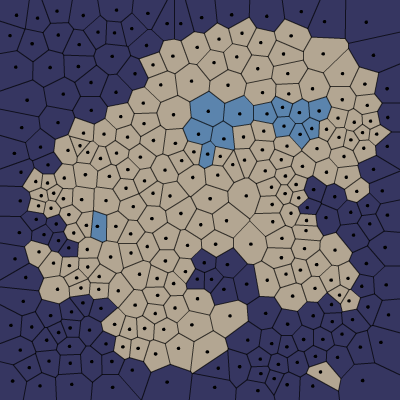
Some water points are not connected to the edges of the map. I ran flood fill starting from the border of the map to determine which water areas are oceans (connected to the border) and lakes (surrounded by land):
Having two graphs means there can be weird cases to figure out. For example, what happens if a polygon has the north and south corners in water, but the east and west corners on land? Is that a land polygon or a water polygon? In every Voronoi-based map project, I have had to try out several different rules until I found something that worked for that project.
4 Elevation#
The most realistic approach would have been to define elevation first, and then define the coastline to be where the elevation reaches sea level. That’s what I did with mapgen1[18] and mapgen4[19]. However, for this project, we wanted players to go uphill from the coast towards a small mountainous area. I started with generating coastlines and worked backwards from there. I set elevation to be the distance from the coast. I skipped lake polygons in the distance calculation, so that lakes would stay flat and contribute to forming valleys.
Having two graphs means I need to decide whether elevation is set on the red center points (Delaunay graph) or blue corner points (Voronoi graph). After some experimentation, I decided for this project it worked better to set elevation on the blue points. Corner-to-corner edges can serve as ridges and valleys. Rivers flow through corner-to-corner edges. After setting the corner elevations, I set the polygon elevation to the average of the elevation at corners.
One problem with the definition is that some islands have too many
mountain polygons and others have too few. To fix this, I redistribute the
elevations to match a desired distribution. I want more low elevation land
(coastline) than high elevation land (mountains). First, I sort the corners
by elevation, and then I reset the elevation x of each to match the inverse
of the desired cumulative distribution: y(x) = 1 - (1-x)^2. Redistributing
values to match a desired distribution is a generally useful technique in
procedural generation.
For any location, going downhill will eventually lead to the ocean. This diagram shows the steepest downhill direction from every corner:
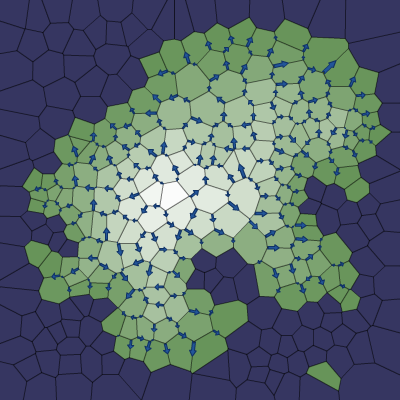
By following the downhill arrows from any location, we eventually reach the ocean. This will be useful for rivers but may also be useful for calculating watersheds[20] and other features.
I had two main goals for elevation:
- Biome types: high elevations get snow, rock, tundra; medium elevations get shrubs, deserts, forests, and grassland; low elevations get rain forests, grassland, and beaches.
- Rivers flow from high elevations down to the coast. Having elevations that always increase away from the coast means that there’s no local minima that complicate river generation.
In the previous section I marked land and water polygons, and in this section I set the elevation to be the distance from the coast. This “elevation after oceans” approach worked nicely for the game’s needs. It generated the type of volcanic islands we wanted for Realm of the Mad God, but it’s not the right thing for all projects. A more common approach is “elevation before oceans”: use noise to generate an elevation[21], and then use the elevation to mark land and water. A more realistic algorithm would also take into account plate tectonics, mountain ranges, rift valleys, and other geological processes.
When using a different elevation algorithm, there can be local minima. The downhill arrows might not always lead to the ocean. There is no one solution to this problem. In mapgen4 I carved channels uphill from the oceans so that they would reach all points. I then reset the elevations to prevent local minima. An alternative to this is to fill the local minima with lakes.
5 Rivers#
I wanted fresh water features: rivers and lakes. The most realistic approach would be to define moisture with wind, clouds, humidity, and rainfall, and then define the rivers and lakes based on where it rains. Instead, I’m starting with the goal, which is good rivers, and working backwards from there.
The island shape determines which areas are water and which are land. Lakes are water polygons that aren’t oceans.
Rivers use the downhill directions shown earlier. I choose random corner locations in the mountains, and then followed the slope down the ocean. The rivers flow from corner to corner:
I tried both polygon centers and corners, but found that the corner graph made for much nicer looking rivers. Keeping lakes flat made elevation lower near lakes, so rivers naturally flowed into and out of lakes. Multiple rivers can share the lower portion of their path. When upper rivers of flow A and B merge, the lower river has flow A+B. I rendered the width of the river using the square root of the flow.
6 Moisture#
Since I’m working backwards, I don’t need moisture to form rivers. However, moisture is useful for defining biomes (deserts, swamps, forests, etc.). Since rivers and lakes should form in areas with high moisture, I defined moisture to decrease as distance from fresh water increases. I tweaked the formula until I got a result I liked:
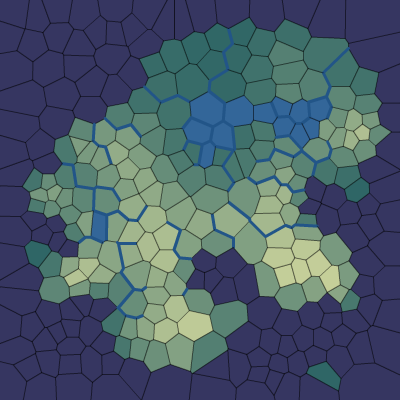
As with elevation, I redistribute moisture to match a desired
distribution. In this case, I want roughly equal numbers of dry and wet
regions. The desired cumulative distribution is y(x) = x, so the
redistribution code is simple. I sort by moisture and then assign
the moisture of each corner to that corner’s position in the sorted
list.
On the map, the moisture data is only used for biomes, but in the game (Realm of the Mad God[22]) we also used moisture to distribute vegetation and monsters.
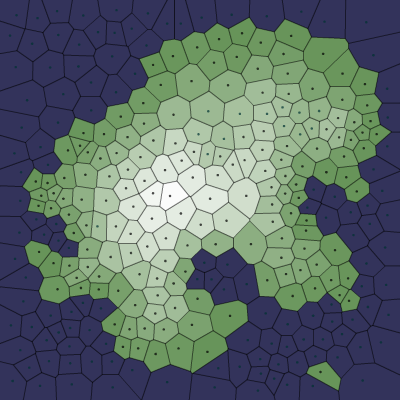
7 Biomes#
Biome types depend on temperature and moisture. On small volcanic island maps being generated here, elevation is a proxy for temperature. Higher elevations mean lower temperatures. In the html5 version of this project[23], I added temperature based on latitude (north/south can be colder than the equator).
Biomes first depend on whether it’s water or land:
-
OCEANis any water polygon connected to the map border -
LAKEis any water polygon not connected to the map border, orICElake if the lake is at high elevation (low temperature), orMARSHif it’s at low elevation -
BEACHis any land polygon next to an ocean
For all land polygons, I started with the Whittaker diagram[24] and adapted it to my needs:
| Elevation Zone |
Moisture Zone | |||||
|---|---|---|---|---|---|---|
| 6 (wet) |
5 | 4 | 3 | 2 | 1 (dry) |
|
| 4 (high) |
SNOW |
TUNDRA |
BARE |
SCORCHED |
||
| 3 | TAIGA |
SHRUBLAND |
TEMPERATE DESERT |
|||
| 2 | TEMPERATE RAIN FOREST |
TEMPERATE DECIDUOUS FOREST |
GRASSLAND |
TEMPERATE DESERT |
||
| 1 (low) |
TROPICAL RAIN FOREST |
TROPICAL SEASONAL FOREST |
GRASSLAND |
SUBTROPICAL DESERT |
||
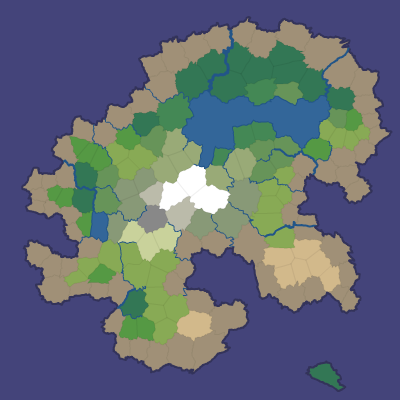
Here’s the result:
These biomes look good in the map generation demo, but each game will have its own needs. Realm of the Mad God[25] used its own biome formula derived from the one I used here. My original biome assignment code was ActionScript[26] but I later rewrote it in JavaScript[27].
Alternatives to consider:
- In mapgen1[28] I used noise to set the moisture level.
- In mapgen4[29] I implemented wind, evaporation, and rain shadows for transporting moisture around the map.
- In this project (mapgen2), moisture is the distance to fresh water.
- A more realistic generator would use groundwater, springs, snow, soil type, and other factors to set the soil moisture level.
- Holdridge Life Zones[30] are an alternative to the Whittaker biomes; there’s also Koppen[31] but it seems descriptive rather than something I can use in a calculation.
- If named biomes aren’t needed, a 2D color gradient can serve nicely; see Tom Patterson’s article on hypsometric tints[32].
8 Noisy Edges#
For some games, the polygonal maps are sufficient. However, in other games I want to hide the polygon structure. The main way I do that is to replace the polygon borders with a noisy line. Why would I want a polygon structure if I’m going to hide it? I think game mechanics and pathfinding benefit from the underlying structure.
Recall from earlier that there are two graphs: one for Voronoi corners (1,
2 in the diagram below) and edges (blue lines), and one for polycon centers
(A, B) and Delaunay edges (red lines) between them:
I wanted to make both types of line noisy without making them cross
lines from other polygons. I also wanted to make them as noisy as
feasible. I realized that points A, 1, B, and 2 form a
quadrilateral, and I could constrain the wanderings of the line segment
to that quadrilateral:
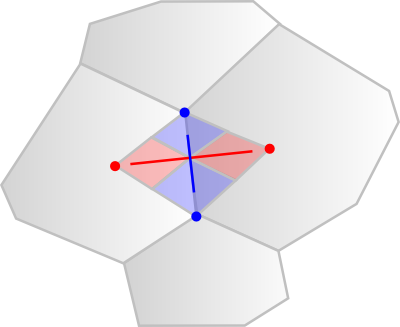
I further divided the quadrilateral into four quadrilaterals. Two were usable for the red (Delaunay) edge and two for the blue (Voronoi) edge. As long as the lines stayed within their allocated space and met in the center, they’d never cross each other. That takes care of constraining them. Note that the quadrilateral may not be convex; to divide it properly, I divide it at the midpoint of the Voronoi edge instead of at the intersection of the Voronoi and Delaunay edges.
The entire map can be divided up into these quadrilateral regions, with no space left over:
That ensures that the noisy lines aren’t constrained any more than necessary. These quadrilaterals might also be useful for game mechanics. I later used them for rendering[33].
I can use any noisy line algorithm that fits within these constraints. I decided to subdivide the quadrilaterals recursively and stitch line segments together within the small quadrilaterals into a complete edge. The result is that the polygon edges are no longer straight:
Noisy edges turn out to have a large impact on the map appearance, especially for rivers and coastlines. For newer projects I’ve used a slightly different algorithm described in this interactive guide[34]. It took some tweaking to get something I liked.
9 More noise#
I’m generally a fan of noise in game art[35], and wanted to add a little bit of noise to these maps as well. In a real game map the noise might reflect vegetation or small variations in terrain. In the demo I filled the screen with a random noise texture by adding a noise bitmap on top. I also smoothed the borders between adjacent polygons by blending the colors in stages:
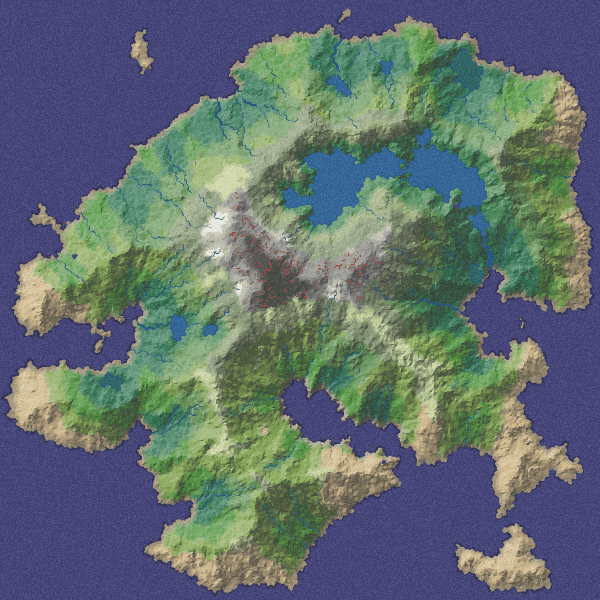
Here’s a rendering with 16,000 polygons, noisy edges, a noise texture overlay, and simple lighting:
10 Smooth biome transitions#
A different way of blending the biomes at polygon boundaries is to build gradients using the elevation and moisture at each corner, and then assigning biomes per pixel:

If the game doesn’t need an entire polygon to be the same biome, this approach can be useful for making more interesting boundaries.
11 Distorted biome transitions#
Another way to make the map look less polygon-like is to distort the elevation and moisture maps:
- Add Simplex or random noise to the elevation and moisture at each pixel.
- Sample nearby points using Simplex or random noise to change the coordinate.
Here’s an example of what this can do:
Adding noise to the elevation and moisture will produce “dithering” in the zones near transitions. Sampling nearby points using noise will distort the shapes of the boundaries.
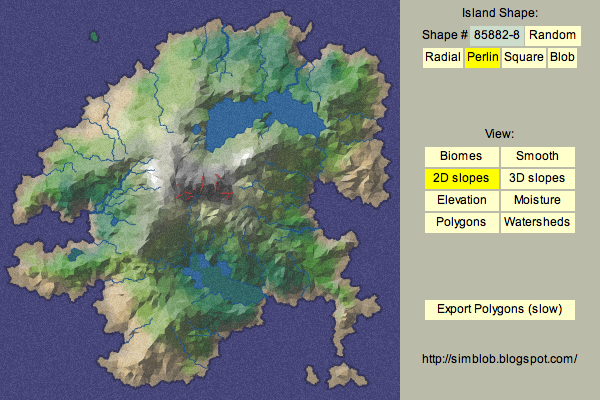
12 Demo#
I wrote a Flash demo to explore the generated maps:
13 Source#
I’ve placed the source code under the MIT license: Actionscript/Flash source code[36]. If you can read Java or Javascript, I think you’ll have no trouble reading the Actionscript. Since Flash is no longer used, I don’t expect that the code will be immediately useful to anyone, but it might be a useful starting point if you’d like to use these techniques for making your own game maps.
-
Map.asis the core map generation system -
graph/*.asis the representation of graphs (polygons, edges, corners) -
mapgen2.asis the demo, with rendering and GUI -
Roads.asis a module adding roads along contour lines -
Lava.asis a module adding lava fissures to high elevation edges -
NoisyEdges.asis used by the demo to build noisy edges
The diagrams on this page are built with 300 polygons, the demo uses 2000 by default, and allows up to 8000. Some of the code for producing diagrams isn’t checked in because it was quick and dirty code only for the diagrams on this page, and not generally useful.
If you find the code or ideas useful, I’d love to hear about it!
I’ve written a tutorial that takes you through generating a Voronoi map step-by-step[37] with Javascript code, including rendering. It’s a simplified version of the algorithms on this page, and it should be a good starting point. I also have the slightly fancier algorithms from this page available under the Apache v2 license: Javascript source code[38]. The web demo is here[39].
13.1 Projects that explore different algorithms#
- Andy Gainey experimented with Voronoi diagrams on a sphere and decided to instead build a map with subdivided isocahedrons[40], with tectonic plates, air currents, temperature, moisture, and biomes. Several people asked me how to extend my map generator to handle continents; take a look at this project and demo[41]. His site is unfortunately gone, but the Wayback Machine preserved some of it.
- Martin O’Leary’s beautifully explained map generator[42] uses Voronoi diagrams with a different terrain generator, erosion simulation, a stylized renderer, city/region generation, a name generator, and a label placement algorithm; you can run it online here[43].
- Scott Turner[44] has explored shading[45], contour lines, wind patterns[46], and procedural mountain/hill icons on his blog.
- Azgaar[47] has built an amazing vector map generator[48] with the ideas from Scott and Martin, and has a great blog[49] with writeups on biomes[50], confluences[51], and other topics. Open source[52].
- (2018) Mapgen4[53] is my successor to mapgen2, with different algorithms that run much faster at a much larger scale. The demo runs with 25k polygons but I’ve also tried it with 1M polygons, which only takes a few seconds. The same core algorithms work with spheres[54] and plate tectonics.
- Miguel Cepero of Voxel Farm[55] was inspired to make a political landscape map using Voronoi regions, and also a map generator using tectonic plates[56] with an alternative to Voronoi.
- Ryan Guy has a project based on Martin’s[57], with some nice diagrams explaining the process.
- Tommy Waters explores plate tectonics[58], in which he shows how he’s producing continents, not only islands, so the mountain ranges are not always in the center of the land masses.
- ylcorcronlth explores moisture calculation based on a random walk[59]
- Cory Lee has a political map generator[60] using Voronoi regions.
- Jesse Morgan has used ideas from this map generator to build a city generator[61] (project page[62] and source code[63])
- Sword & Scroll uses a Voronoi map generator to create political zones[64] (baronies)
- Phill Spiess also uses Voronoi and noisy edges for his project[65] but no details are posted.
- Christophe Le Besnerais has a Javascript version[66] that has a more advanced water flow model; luckylooke has a version of it for Phaser.io[67].
- Kaelan Cooter has a hexagon world map generator[68] with elevation, moisture, biomes, rainfall, aquifers, and territories.
- Andy Lo[69] has a Voronoi-based map generator in Unity, with source code[70]. He uses tectonic plates with uplift to generate the mountains.
- Xiang Wei has a spherical world generator[71].
- Alexey Nabrodov wrote a map generator and wrote a page about the process[72] (Russian), and released source code[73].
- Little Cube Valley[74] uses Voronoi maps with aquifers, wind, temperature, drainage, salinity to determine rivers and biomes.
- Luca Morselli’s map generator page[75] has interactive demos of each step of the generation
- Nortantis[76] uses plate tectonic simulation to create islands and continents
- Nexus Maps[77] by nexus723 (reddit[78]) uses Voronoi with weather, coastlines, rivers, biomes, settlements, roads, trade routes, nations, ports, and other features.
- Vagabond[79] uses Voronoi to construct wilderness maps with rivers, towns, climates, roads, forests.
- (2025) Civilization 7 changed their map generator to use Voronoi[80] with plate tectonics
- Tom Betts[81] generates elevation starting from multiple mountain peaks going down instead of the coastline going up like I did, and then uses pathfinding to create roads and rivers; Run it here[82]
13.2 Similar algorithms in other programming languages#
- (2022) I have a tutorial showing how to make these types of maps[83] with JavaScript code for every step, including rendering.
- Richard Janicek has a Haxe version[84] that compiles to Javascript+Canvas, with a demo[85] {broken as of 2023}, and also a Javascript version[86], with a demo.
- Jeff Terrace has contributed patches and also wrote a utility to convert the XML into COLLADA[87], as well as a COLLADA viewer[88] in WebGL.
- Alex Schröder has been working on a Perl version[89] that generates SVG output. {screenshots broken as of 2023}
- Christopher Garrett has written a Voronoi/Delaunay port for iOS[90].
- Christophe Guebert has written a Java+Processing version[91].
- Baran Kahyaoglu has written a C#/.NET version[92], and abhimir has a Unity version[93] of Chris Herborth[94]’s version of Baran’s code.
- Tommy Waters has another Javascript version[95], with source[96] and a blog post[97].
- Егор Харват has a Haxe/NME version[98].
- Connor Clark has a Java version[99].
- Kylepixel has a Javascript project[100] that also uses Voronoi regions for map generation.
- Nuclear Horse Studios has a C#/Unity version[101] (MIT license).
- Stafford Williams also has a C#/Unity version[102] (MIT license).
- Gareth Higgins has a C# map generator[103].
- Martín Candela Calabuig has a C++ version[104].
- Tobias is working on a C++ version[105].
- Spencer Judge has C++ code[106] for a map generator using these techniques.
- BitAlchemists has a Dart version[107] and source[108] (MIT license).
- Thomas R. Koll has a Lua port[109] that he’s using for Autonomous Planetary Research Individual 50[110].
- Island[111] is a Scala project that uses techniques similar to the ones on this page.
- PtolemyJS[112] is a Javascript game engine that includes a Voronoi region map generator.
- Jay Stevens has a C++ Unreal 4 version[113] (MIT license).
- Carl Wieland has a Swift version[114], no license given.
- Steve Johnstone has a C#/Unity version[115] (MIT license).
- DeiveEx has a C#/Unity version[116], no license given.
13.3 Other projects#
- PolyWorld[117] is based on Connor Clark’s Java code, and is now part of the Terasology game (watch this video[118]).
- TerraFirmaCraft 2[119] uses these techniques for their game, with a hex grid.
- Vagabond[120] uses these techniques for their world generator.
The map generator wasn’t designed for direct use but Welsh Piper (encounter tables[121], Minocra[122]), Kingdoms in Trevail[123], Cresta[124], Life & Thorn[125] (comics), and others ( 1[126], 2[127], 3[128], 4[129], 5[130], 6[131], 7[132], 8[133], 9[134], 10[135], 11[136], 12[137], 13[138] ), are using the map generator to create maps for their projects. You can use the “export PNG” button to export a 2048x2048 PNG that you can then adapt with Photoshop to color, style, and annotate for your own needs.
14 Appendix: More map features#
14.1 Modules#
I tried to structure the map representation so that modules could
annotate them without creating a code dependency. The GUI module
mapgen2.as depends on Map.as (core) and Roads.as (non-core), but
Maps.as does not depend on Roads.as. Every polygon, edge, and
corner in the graph has an index, which can be used as a key into an
external table. In Roads.as, there’s a road array that’s indexed by
the edge index.
Where core map code can reference edge.river as a core field, the module
can’t do that. Instead, the module references its local variable
road[edge.index]. This works for polygon centers and corners as well. It
keeps the core clean. If you’re familiar with ECS[139], you can think of this as
a form of components.
I have three modules: Roads, Lava, and NoisyEdges.
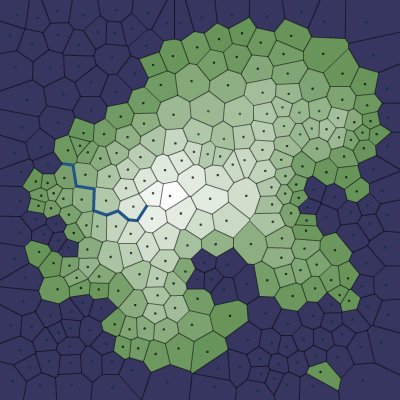
14.2 Roads#
Realm of the Mad God doesn’t use most of the features of this map generator, but I built a road generator for them. I observed that in the game, people naturally explore rivers. This unfortunately leads them up to the mountains, where they die. I wanted to build some roads that are at right angles to the rivers.
I calculated contour lines along the corners. Where the contour level changes, there’s a road. It’s a fairly simple algorithm that works most of the time, but sometimes creates tiny loops:
Whereas rivers meander along Voronoi edges (blue lines in the diagram above), roads go on Delaunay edges (red lines). Roads don’t get the noisy edge treatment. Instead, they are drawn with splines from edge midpoint to midpoint:
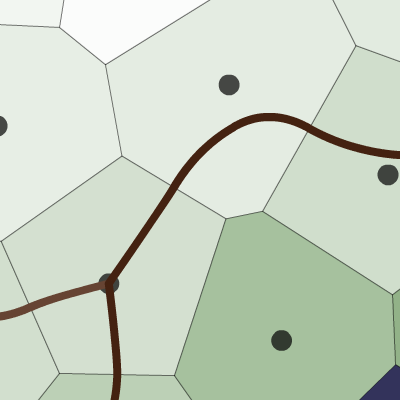
Most polygons have two neighbors with roads. For them, there’s a regular spline connecting the two edge midpoints. For polygons that have more than two road neighbors, I instead draw an intersection, with splines from all the edge midpoints to the polygon center. In the diagram above, the lower left polygon has an intersection and the upper right polygon has a regular spline.
Roads cross the edges while rivers follow the edges, so that makes it easy to turn a road into a bridge when it crosses the river.
14.3 Lava#
Lava and rivers follow the same paths. Lava fissures occur in high dry areas, and are assigned to some subset of the edges. In a game, lava and water will of course be different, but here they only differ in color and placement. Lava gets the noisy edge treatment:
15 Appendix: Future possibilities#
15.1 Abstract Rendering#
A map should show the relevant portions of the world, not all the details. With this projects I’m generating maps with some level of detail, but it’s not detailed down to the vegetation or towns, and it’s not completely abstract either. It may be possible to render a more abstract map in the style of maps of Middle Earth (such as this one[140]). I made some notes about what I want from game maps[141].
15.2 Watersheds#
By following the downslope arrows (described in the section on elevation), there’s a path from every polygon corner, along edges, to the coast. I use this to mark every corner with the location where the water would flow out to the ocean. All corners with the same outflow location can be considered to be part of the same watershed.
The watershed code is incomplete. There’s a watershed view in the demo, but I’m not happy with it. I’ve tried polygon centers and corners as watershed boundaries and neither is quite right. I have put watershed calculations on hold until the day I need them.
The place I thought watersheds would be useful is for naming larger regions[142]. There are roughly 1000 land polygons on the map in the demo. In a game map it might be nice to have a smaller number of named regions that group together polygons. For example, the XYZ Mountains can be above the XYZ Valley, which might have the XYZ River flowing through it. Players would be able to learn that these features are related. I didn’t get very far with this project but I might come back to it someday.
15.3 Impassable borders#
In this map generator all the borders between polygons are the same. There’s a smooth transition from one to the other. It might be interesting to make some edges discontinuous, so that we can make cliffs, chasms, plateaus, and other sudden elevation changes. See this article[143] for ideas on how to make the Voronoi regions interesting for gameplay.
15.4 Terrain analysis#
Pathfinding should be fairly fast on a polygonal map, and may be useful for terrain analysis. For example, if two locations are spatially close but pathwise far, that may mean there’s a bay or mountain in the way, and that’d be a good place for a tunnel or bridge. A pathfinder could also help find places where we need bridges to nearby islands. Polygons that show up on paths often might be strategically more valuable than polygons that rarely are used for paths.
15.5 Named areas#
As mentioned in the watersheds section, I’d like to name map features. Combined with terrain analysis, names could be assigned to rivers, mountains, lakes, groups of polygons, coastlines, oceans, forests, peninsulas, valleys, etc. Names in an area could be related. For example, the XYZ River could flow from Mount XYZ through the XYZ Valley. I haven’t worked on this in part because I think it helps if it’s for a specific game instead of a generic map generator. Not only should names connect to the game’s theme, there could be items and quests and plot elements that are related. For example, the Sword of XYZ might be found only in the XYZ Valley.
15.6 Variable density#
Fortune’s algorithm should work within a polygon to subdivide it into smaller polygons. A map where most of the world is coarse, but some areas are more finely divided, could be interesting. Alternatively, we could place the original points with variable density so that some areas get more polygons than others. For example, we could use Poisson Disk Sampling[144] instead of Lloyd’s Algorithm.
15.7 Better noisy edges#
I implemented a very simple noisy edge system, with jagged lines. The corners are very visible when you zoom in on the map. A better system might involve curved splines, or a fractal expansion that looks more detailed as you zoom in.
16 Appendix: Process improvements#
This page started out as three blog posts on the topic: part 1[145] is about polygons, map representation, islands, oceans and lakes and beach and land; part 2[146] is about elevations, rivers, moisture, and biomes; and part 3[147] is about rendering, demo, and source code. Having it all on one page made more sense in the long term.
For those of you interested in how I got to this point, a brief history:
- In December 2009, Rob and Alex of Wild Shadow Studios had asked me if I had a quick way to generate maps. I had already been thinking about using Perlin/Simplex noise for maps, so I tried it, with good results[148]. I got something going within a day, and then spent the next month tweaking and trying variations. Most of the variations failed, and taught me that there were limitations with this approach. One month was a good time to stop, so I stopped working on maps and moved on to other small projects — art, animation, monster groups, NPC AI, among others.
- In June 2010, I was inspired to work on maps again. I spent the month sketching out ideas on paper and trying some prototypes. I tried hexagon grids, hexagonal river basins, quadrilateral river generation, volcanos, hills, erosion, weather systems, and a few other things. Everything failed. However, I learned a lot by trying these things out. Delaunay triangulations for example didn’t work out, but they led me to Voronoi diagrams. The quadrilateral river generation didn’t work out, but the quadrilaterals were useful later when I worked on noisy edges. The erosion system didn’t work out, but some of the same ideas were useful when I worked on rivers.
- While attending the Procedural Content Generation workshop, I sketched out some more ideas on paper for map generation. During the July 4 long weekend, I implemented these, and they worked really well. I worked out Voronoi polygons, map representation, island generation, noisy edges, elevation, biomes, rivers, and elevation redistribution that weekend. I experienced flow[149]. It was great! Most of the core system was in place in only three days.
- Every weekend in July and August, I made improvements, many of them substantial. I also made many changes that didn’t work out, and I deleted them. As the core map features became good, I shifted my focus to the map rendering and the UI. As the map rendering and UI improved, I was able to see more flaws in the maps, and I found lots more bugs I needed to fix. I also made major refactorings to simplify the code that had grown organically.
- By the end of August I found that I was only working on minor things, and decided the project was ready to wrap up. I spent the Labor Day long weekend writing up the results on this page (and the blog posts). Much of my time went into making good diagrams. The diagrams actually exposed more bugs, and I ended up making bug fixes, greatly simplifying one feature (elevation redistribution), and implementing a new feature (moisture redistribution). I also renamed and commented code to make it easier to explain.
Why am I keeping track of this? It’s because I’m trying to improve the process by which I approach these small (1-3 month) projects. There are some things I want to remember:
- It’s useful to have a key idea that drives everything else. The simple maps I did in January were based on Perlin Noise. These maps are based on Voronoi diagrams. I need to pick something and go with it, but only after…
- It sometimes takes a lot of experimentation before I run across the right idea. I spent a month on ideas before coming up with Voronoi as the key structure. I need to sketch out lots and lots of ideas.
- I have a lot of failures. The key is to fail quickly, not to avoid failing. I need to not get discouraged.
- I got the core system up in three days. A quick prototype can tell me a lot about whether an idea’s going to work out. In the early stages I need to focus on a prototype and not worry about making it a high quality system.
- In the very early phase it’s more important to learn from the system than to produce good code. I need to ask myself what I’m trying to learn with a prototype.
- Failures are sometimes useful later. I need to keep them accessible. I’ve been deleting the code as soon as it fails, but maybe I should make lots more git branches and store them there.
- The ability to see things can help a great deal in understanding what’s going on. I missed several bugs because I never bothered to build a visualization for that part of the data. I need to display as much as I can.
- There are sometimes tiny things that seem wrong that actually mean I have a bug somewhere. I often shrug these things off. Even if it’s not a good time to investigate and fix some bug, I need to track them somewhere so that I can later investigate.
- Writing the blog posts helped tremendously. It forced me to understand every part of the system, to look at all the data, and to make sure all the code could be understood. It made me question every phase of map generation and improve the ones that were hard to explain. I need to write blog posts much earlier in the process. Explaining is a good way to learn.
I’ll keep these in mind as I work on future projects.
17 Appendix: References#
Thanks to the Dungeon League blog[150] for a great series on procedural map generation, and the Procedural Content Generation wiki[151] for ideas for map generation[152].
My thanks to nodename for as3delaunay[153]. It’s an Actionscript 3 library for generating Voronoi and Delaunay graphs. Also my thanks to polygonal for the PM_PRNG[154] random number library, which allows me to use and reset the seed value so that I can reproduce a series of pseudorandom numbers. I used the OptiPNG library[155] to optimize the PNG images on this page. I used this software in 2010 but by 2015 I had switched to different libraries.
Delaunay triangulation[156] and Voronoi polygons[157] are taught in many graphics classes. For example, see Stanford CS 368[158](PDF). I also looked at relative neighborhood graphs[159] and Gabriel graphs[160] but didn’t use either.
Delaunay triangulation can be used for maps, in the form of triangular irregular networks[161]. Voronoi diagrams are also used for maps. For example, see this blog post about using Voronoi for Unangband biomes[162].
Fortune’s Algorithm[163] is one of several algorithms that can turn a set of points into Voronoi polygons. It’s implemented in as3delaunay. Lloyd Relaxation[164] is used to improve the distribution of random points. It decreases the irregularity of the Voronoi polygons.
The Voronoi wiki (went down in 2020) had some incomplete pages on graph representation[165] and edge representation[166], as well two pages that helped me with river generation: rivers and watersheds[167] and crust and skeleton[168]. I am linking to the Wayback Machine version of these pages.
The Relief Shading Website[169] has some images of shaded relief maps[170], as well as design guidelines for shading and coloring. I am sad to say I did not have time to apply these techniques. I also studied Bing and Google maps to see how they draw various features; see this article[171] and my blog post[172] and this article[173].
The Whittaker diagram[174] is one way to predict common biomes given climate. Wikipedia has a page listing biome classification schemes and various biomes[175].
Wikipedia also has a nice list of landforms[176] that one might want to generate in a game map generator. I did not explore these for this project.
Ken Perlin created Perlin Noise, and then he made a sequel, Simplex Noise[177] [PDF]. For this project I used Perlin Noise for the overall island shape. I used Perlin instead of Simplex because Flash included it in the standard library, but I use Simplex for all my newer projects. Joe Slayton has a page on how to turn perlin noise into islands[178]. I was looking for “blue noise”, which led me to Dunbar and Humphreys’s paper on noise generation[179] and recursive Wang tiles[180] before I found Lloyd’s algorithm for better random point distribution. I also looked at Craig Reynold’s textures[181] but didn’t have time to do anything with them.
Also interesting were these papers about generating worlds[182] (the author has continued writing interesting papers since I published this page in 2010), Gozzy’s wilderness map generator[183], donjon’s world generator[184], a paper on procedural road generation[185]. Straight skeletons[186] seemed like they might be useful for defining mountain ranges, but once I discovered how well “distance from coast” worked, I didn’t need anything else. The 3D map generation in Dwarf Fortress[187] is pretty neat.