SimProf: Phase-based visualization of parallel programs
Bob Lantz
Computer Systems Laboratory
Stanford University
Traditional statistical profiling - which tells you how much time you are spending in a particular routine,
but not when or where - provides limited insight into the performance of parallel programs.
By visualizing the activity of parallel programs over space and time, we gain detailed insight
into their performance. My SimProf tool is an interactive visualizer, written in the Cocoa
environment on Mac OS X, that shows what a parallel
application is doing on any processor (vertical axis) at any point in time (horizontal axis.)
The colors denote specific routines (you can click on any location to pop up a colored menu describing
the routine and time), with barrier time as black, synchronization time as white, kernel time
as blue, and idle time as grey. This can show us, for example, that a program is wasting time in
a long startup phase, or that certain threads are finishing computation before other threads, a load
imbalance which results in wasted time as the fast threads wait for the slow threads to catch up.
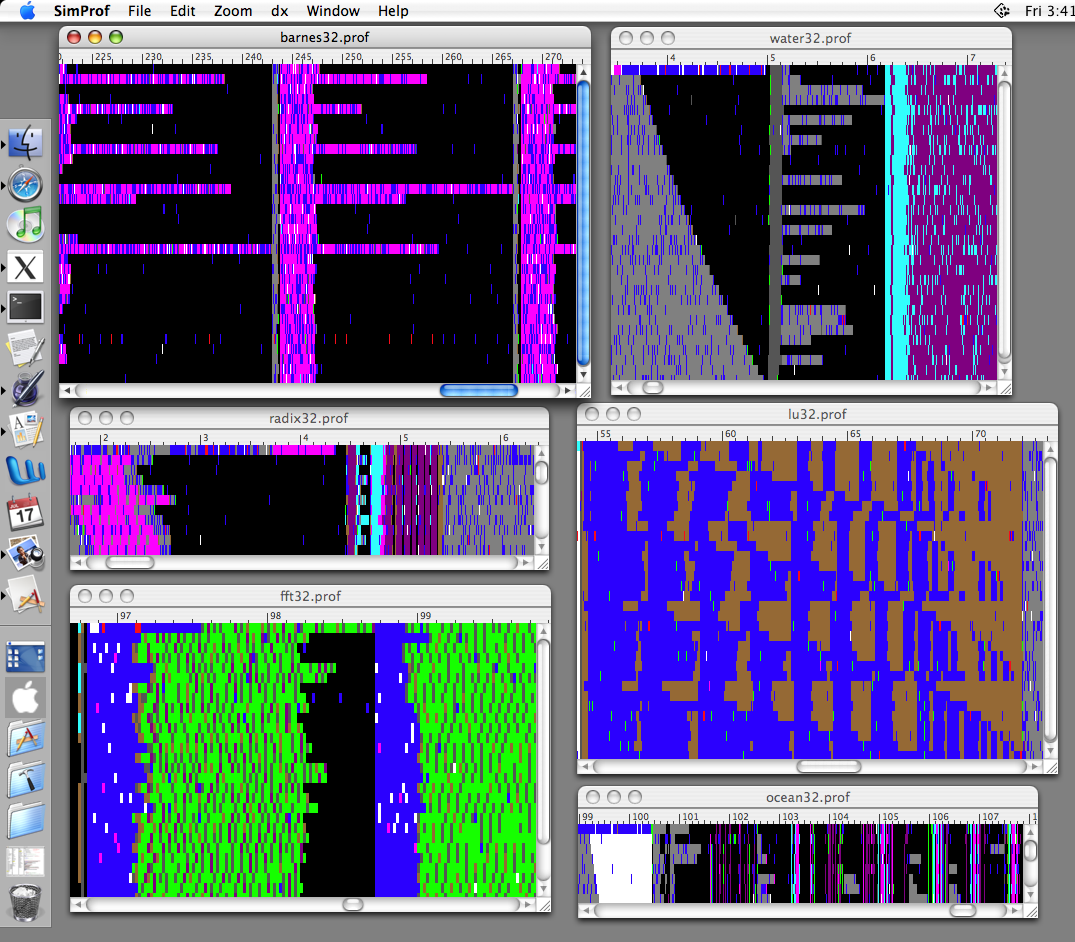 Screen shot of SimProf visualizing the performance of several parallel applications in the
Parallel SimOS simulation environment.
SimProf implements cut and paste, drag and drop, rulers, scaling and printing. This versions is a Mac OS X (Cocoa) application.
Screen shot of SimProf visualizing the performance of several parallel applications in the
Parallel SimOS simulation environment.
SimProf implements cut and paste, drag and drop, rulers, scaling and printing. This versions is a Mac OS X (Cocoa) application.